A. Diversity in the UK

UK = 63m (2015)
England = 56m
Motto: "Dieu et mon droit"
"God and my right
"God and my right
What's in a name?
Say ‘people from a Mixed ethnic background’ or ‘people with a Mixed ethnicity’.
- In 2017, the UK Prime Minister commissioned a Race Disparity Audit
- with results published on the Ethnicity Facts & Figures website:
- In 2018 about 18% of the England population
- was from a minority ethnic background
- Asian Ethnic .... .... .... 4 m
- Black Ethnic .... .... .... 2 m
- Mixed Minority Ethnic .... 1.2m
- with London having 40% of its population from
- the Black, Asian & Minority Ethnic (BAME) background.
Diver-cities:
BAME individuals in politics & local government (as of May 2019)
- 8% of MPs are Black, Asian and Minority Ethnic
- 14% of local councillors are BAME
B. Diversity in the US ... link
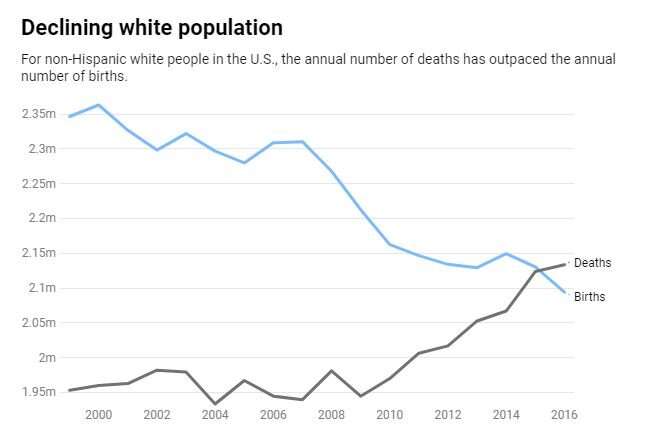
- Declining numbers. The proportion of whites in the U.S. population eventually reached just over 60% in 2018 – the lowest percentage ever recorded.
- In 2018 nonwhites accounted for more than 50% of Hawaii, the District of Columbia, California, New Mexico, Texas and Nevada. And, in the next 10 years, these 6 "majority-minority" states will likely be joined by as many as 8 other states.
- Growing numbers. Minorities accounted for 92% of the U.S. population growth between 2010 and 2018.
- Over the past decade, ... link
- Asians had the biggest growth rate (almost 30%). Almost two-thirds of that growth was driven by international migration.
The Hispanic population grew by 20% since 2010, with almost 3/4 of that growth coming from a natural increase that comes when more people are born than die.
The Black population grew by almost 12% over the decade, and the white population increased by 4.3%.
C. Diversity in the EU
EU metropolitan areas are multicultural, multi-ethnic, and multiracial societies by now.
TASK: Belgique / Portugal / Sweden / France
............ ........ ......... .........
Relate these figures (25% - 11% - 15% - 8%) to the 4 states above:
Belgique = 11.5m
Capital 1.2m (Metropolitan area 2.5m)
Portugal = 10.5m
Capital 0.6m (Metropolitan Lisbon 2.5m)
Sweden = 12 m
Capital 1m (Metropolitan area 1.6m)
France = 67 m
Capital 2.6m (Metropolitan area 12.5m)
6min 2017 video FR24
=========== ============ ============
Switzerland = 10.5m
ZURICH. link . The intercultural city has people with different nationality, origin, language or religion/ belief. Political leaders and most citizens regard diversity positively, as a resource.The population of the City of Zurich is getting younger and more international.
No comments:
Post a Comment